
Revenue Drop Root Cause Analysis
Go from "revenue dropped" to "here's exactly why" — in minutes, not days. Validated, auditable, and repeatable.
What Is Revenue Drop Analysis?
Revenue drop analysis is the systematic process of decomposing a revenue decline to find the root cause. Instead of guessing, you quantify exactly which dimensions drove the change:
- Which channel, product, or region contributed most to the decline?
- Was it fewer deals (volume), lower prices (ASP), or a shift in product mix?
- When exactly did the trend change, and does it align with a known event?
- Is the drop a one-time anomaly or a sustained trend?
When revenue drops, the typical response is a scramble through dashboards, ad-hoc queries, and Slack threads. Yorph replaces that with a systematic, automated decomposition backed by the same structured methodology used for any complex analytical problem.
How Yorph Solves Revenue Attribution
Yorph doesn't just filter your dashboard. It builds a structured, validated pipeline that systematically identifies root causes — using the same rigorous methodology we apply to every complex analysis.
Structured Attribution Method
Yorph selects the right decomposition approach: metric decomposition (Revenue = Volume × Price × Mix), dimensional slice-and-dice across all attributes, driver tree tracing, or change-point / anomaly analysis. Often it layers multiple methods for a complete picture. The agent confirms specific business logic with the user, ensuring a user is always in the loop.
Multi-Agent Planning
Before writing a single query, multiple AI agents independently propose decomposition strategies — exploring different dimension hierarchies, comparison periods, and causal hypotheses. The strongest plan is selected.
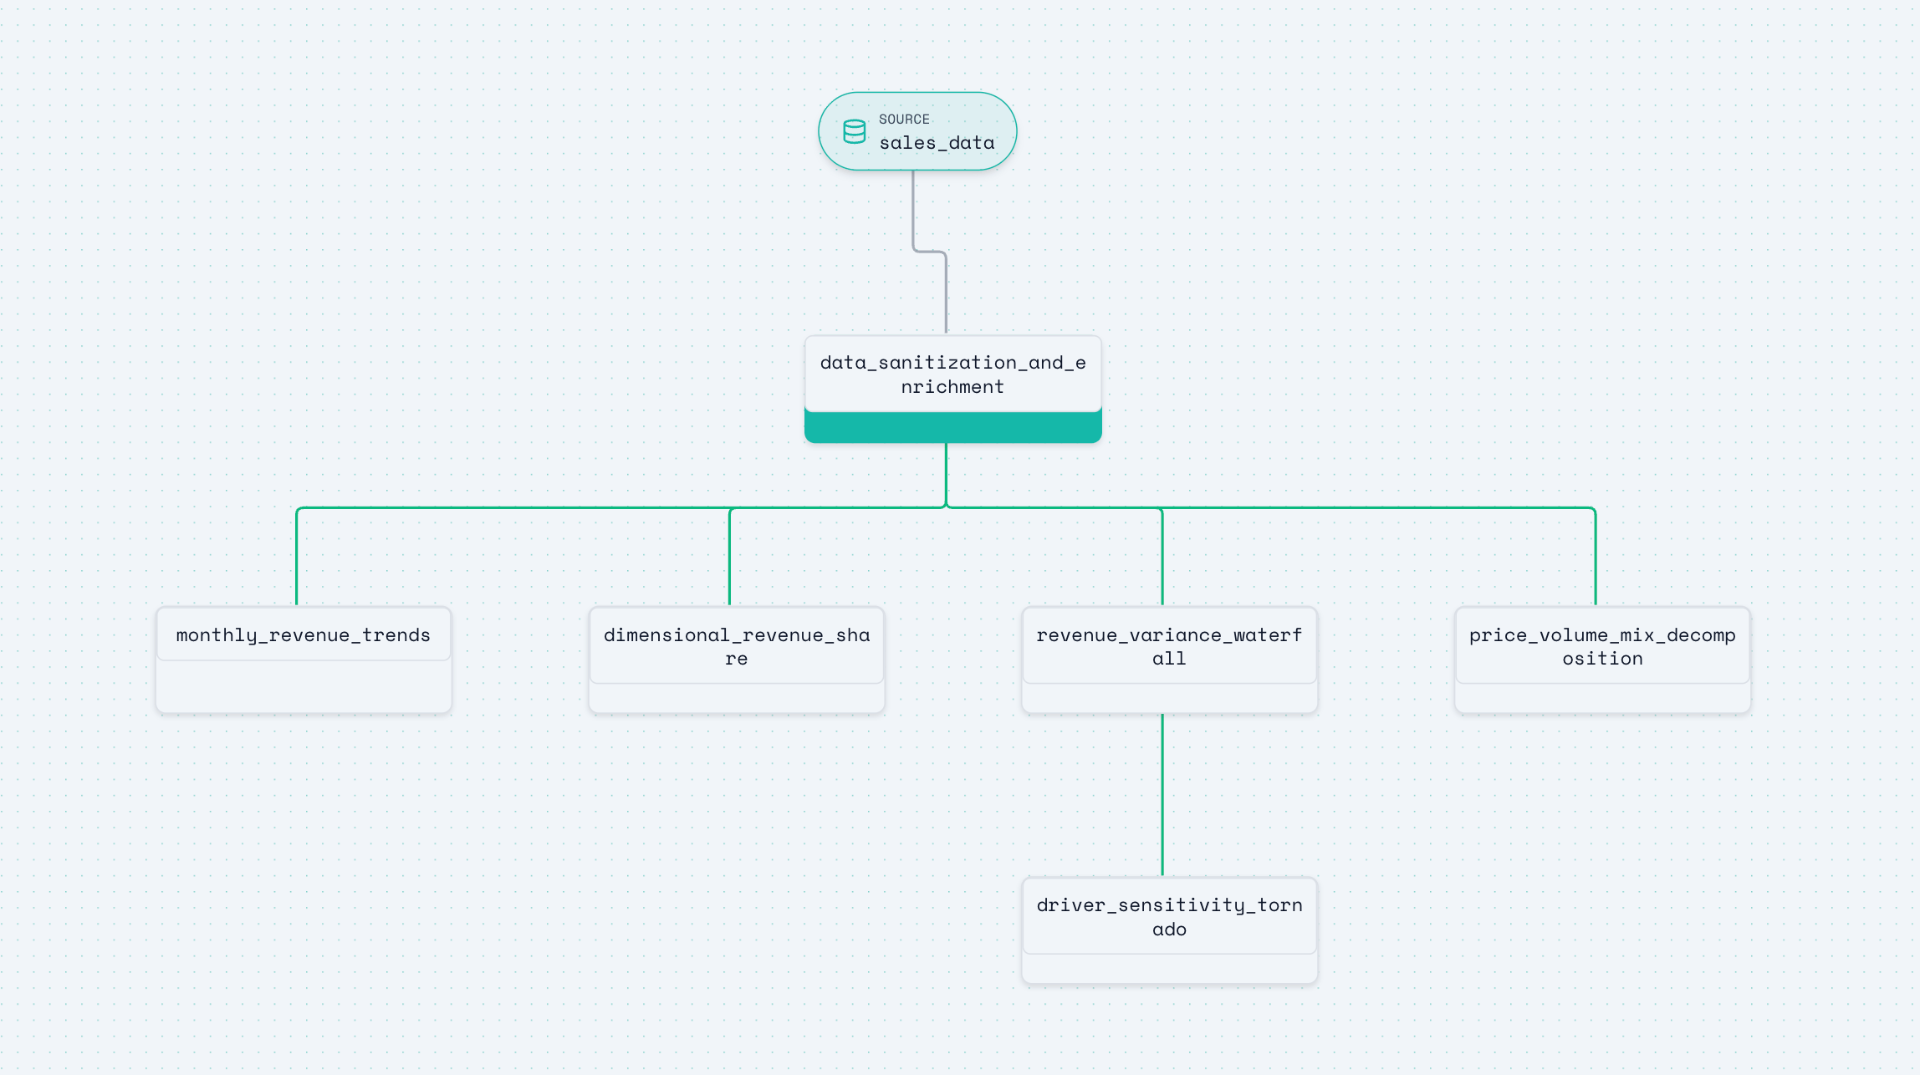
Modular, dbt-Backed Pipeline
Yorph creates a modular pipeline: data cleaning, dimension scanning, volume-price-mix decomposition, change-point detection, and impact ranking — each step versioned, editable, and reproducible.
Validation Before Results
Before surfacing root causes, Yorph validates: Do the explained deltas sum to the observed change? Is the output granularity correct (no join explosions)? Are results stable when you shift the analysis window? If any check fails, the agent loops back and reruns.
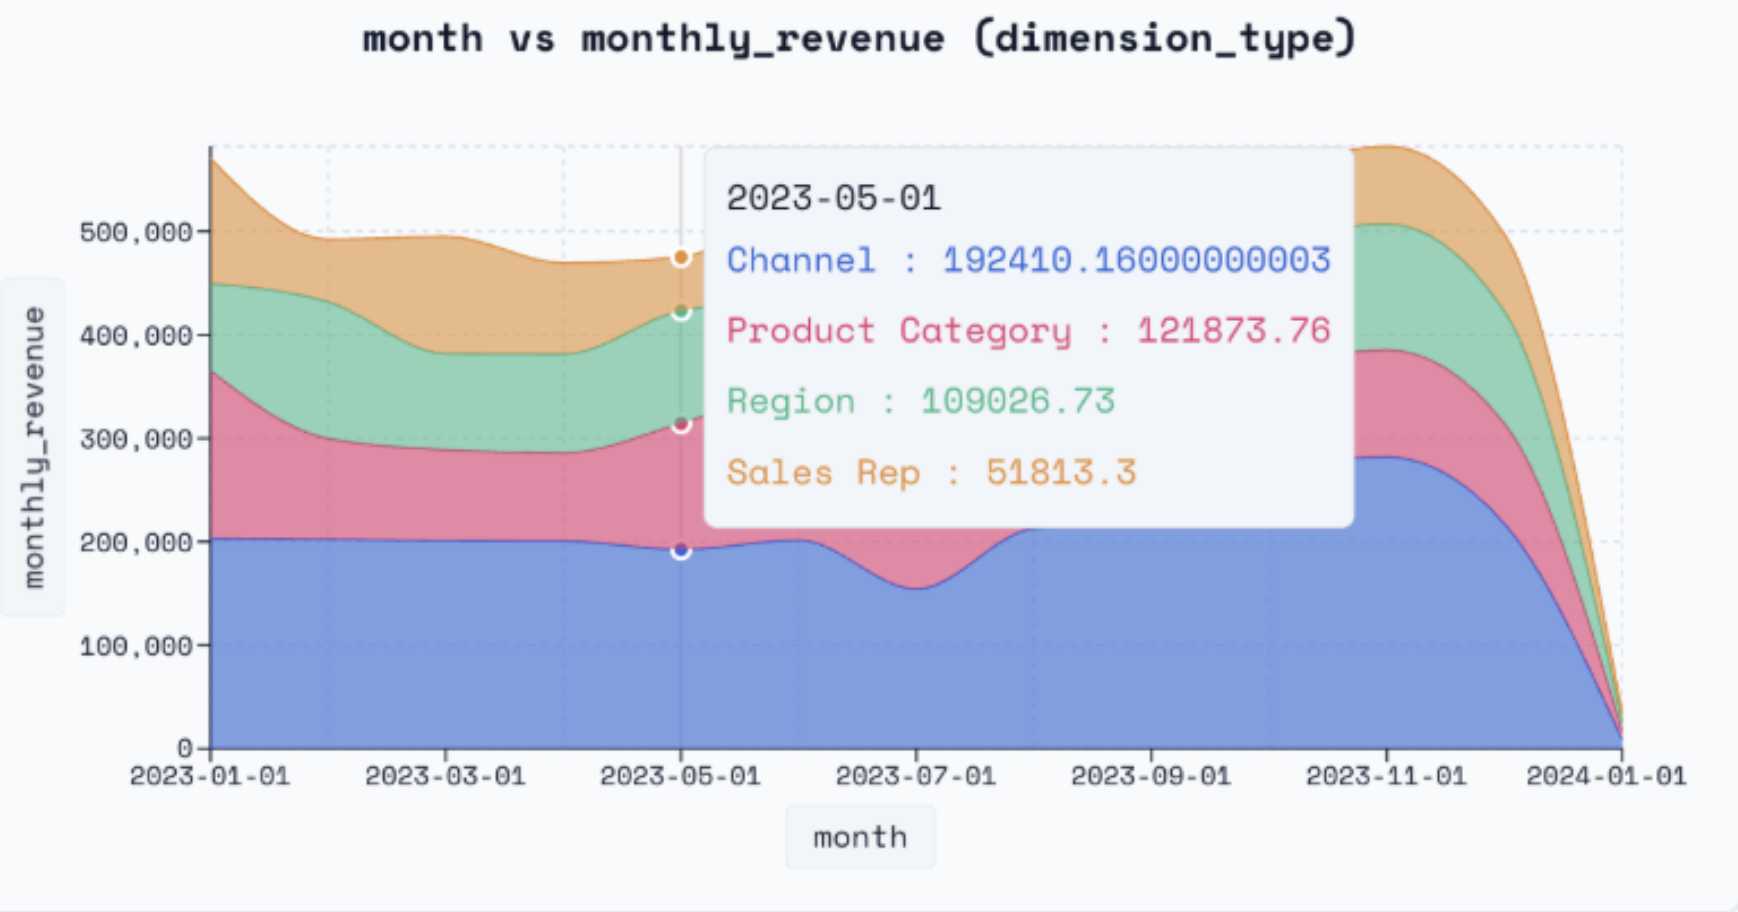
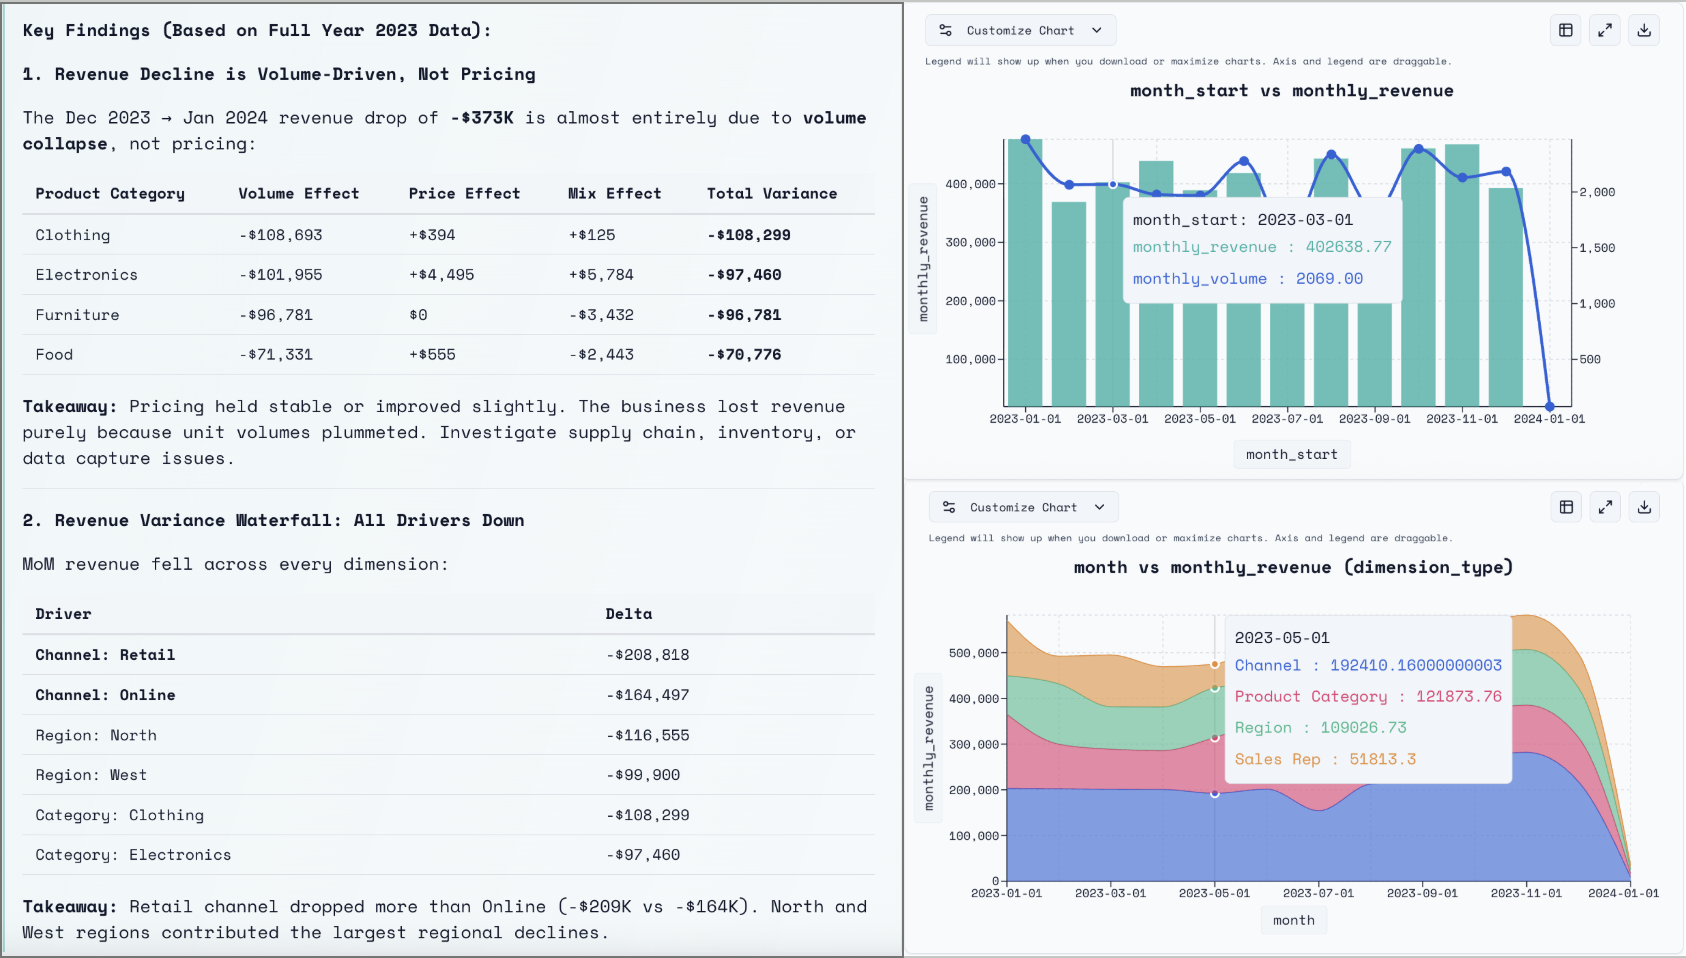
Insights, Visuals & Assumptions
Yorph produces ranked driver charts, waterfall decompositions, and natural-language summaries identifying the top contributors. Every assumption is reported — column definitions, cleaning applied, comparison periods used — so you can share with executives confidently.
Schedule & Operationalise
Turn your revenue analysis into automated health monitoring. Schedule the pipeline to run weekly or monthly and get proactive alerts when trends deviate — before the quarter-end surprise.
The Attribution Analysis Pipeline
Every attribution analysis produces a modular, versioned pipeline — fully inspectable from source tables through to the final revenue driver breakdown.
Frequently Asked Questions
What is revenue drop analysis?
Revenue drop analysis — also called root cause attribution — systematically decomposes a revenue decline by dimension (channel, product, region, rep) to pinpoint exactly what drove the change.
How is this different from filtering a dashboard?
Dashboards require you to manually check each dimension. Yorph systematically tests all dimensions and ranks them by impact — ensuring you don't miss the real driver.
Can Yorph decompose into volume, price, and mix?
Yes. Yorph supports volume-price-mix decomposition so you can see whether a drop was driven by fewer deals, lower prices, or a shifting product mix.
How do I know the root cause is correct?
Yorph validates every finding: deltas reconcile (explained change matches observed change), grain is correct (no join explosions), and results are stable across different segmentation approaches.
Can I automate revenue health monitoring?
Yes. Schedule your revenue pipeline to run on any cadence and get proactive alerts when trends deviate — before the quarter-end surprise.
Diagnose Revenue Drops in Minutes
Start for free — no SQL required. Get validated root cause attribution instantly.
Get Started Free